Diabetes, Project - Causal Modelling
There are many different methods that can be used to analyze diabetic patient's data. I've already discussed on more than one occasion that not all problems can be solved with a data-oriented approach, but in this article I want to give a brief overview of a couple of building blocks that can be used when approaching these problems with an inference based analysis. In particular, I want to focus on aspects related to causal inference, where the goal is trying to have the most "confidence" possible that the relationships that we find in data are actually of the cause-effect kind. If we know that, we can plan interventions.
Here I want to talk about a couple of methodologies that we can apply to a real case. It will not be a tutorial, but a list of ‘features’ that our analysis must have in order to be reliable. Also I'll not dive into any theory, there are amazing resources already. I’ve made a small example version, in python, of what is described here with a couple of comments more focused on some issues about the implementation side; all examples are reproduced through synthetic data for privacy reasons, so some results might seem somewhat unusual.
Needless to say, don't try this at home, kids. I'm not suggesting that this is a viable method that you should try: obligatory disclaimer. As for some caveats with regard to the actual modelling: perfection is impossible, no statistical or mathematical method can perfectly deal with the complexity of analyzing diabetes-related data. There is always an assumption that is hard to justify, a model too imprecise, a theory that is hardly applicable to the problem at hand. At the same time, from empirical evidence, these tools can be effective, but you need to be extra careful.
A practical problem
My specific case involves being a caregiver for someone who has suffered from type II diabetes for decades. At one point, an alarming situation developed: this person could no longer sleep properly, averaging only 2.5 hours of rest per day, even including short afternoon naps. This prolonged sleep deprivation was leading to a failure of liver functions, a condition exacerbated by the high number of medications that had to be taken daily to manage diabetes and other comorbidities. Without going into unnecessary clinical details the following approach was used as a last resort, after numerous specialists were unable to find a solution through conventional means.
So we want to find what are the causes of the lack of sleep, and we want to rank, in some way, the impact of each one of them so that we can prioritize our intervention. Also, our findings need to be in accord with the medical literature.
Let's divide this task into a couple of sub-problems:
- Find a way to represent the state of my current knowledge and hypothesis.
- Validate, if possible, the assumption that we made.
- Select a statistical method that can account for a small sample size.
- How to monitor the results over time alongside any eventual intervention.
Again, what follows is a simplified example of some core techniques and methodologies that can be applied. For each sub-problem there are many, and probably better, methods that can be used.
1. Current knowledge and hypothesis
It's safe to say that causality is the holy grail of statistical analysis. If we could somehow achieve reasonable certainty that our mathematical model exhaustively describes all significant cause-and-effect relationships that influence a particular variable, then we would also know how much and in what way each variable affects the outcome we want to achieve. Consequently, we could create an intervention plan to obtain the desired result. In many cases, this can't be done. But there are methods that offer us a structured way to know what we can and cannot say so that we can clearly define the boundaries of uncertainty.
One of the tools that we can use for representing our assumptions and hypotheses are DAGs. With these diagrams we can both encode our existing knowledge about the problem, but also our hypothesis, because the relationships that we draw in our diagram can be refuted with data.
A Simple Example: Sleep and Carbohydrates
A very simple example of DAG could be the following. Our target variable is the duration of sleep, the quantity that we want to influence. Then we have other variables that, based on the medical literature and our context knowledge, can influence sleep duration.
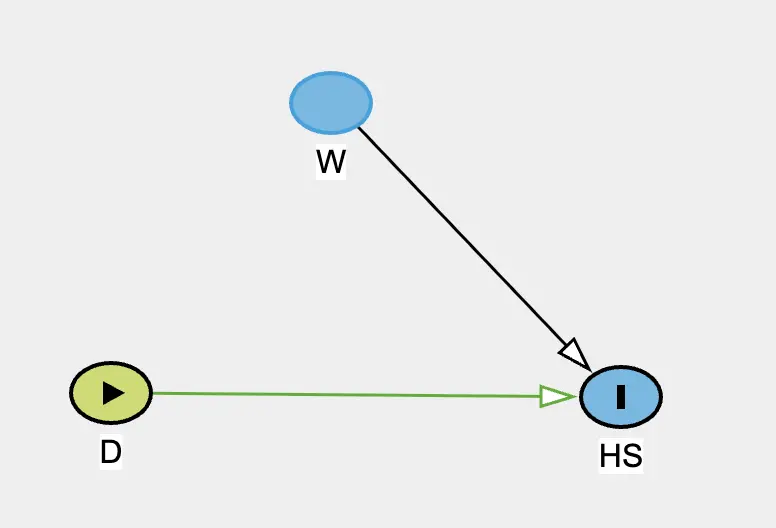
Let's say HS represents the number of hours slept in one night.
We'll also define D, representing the amount of carbohydrates consumed at dinner and
W, representing whether that patient took a walk after dinner or not.
What are we really saying with this diagram?
The amount of carbohydrates consumed at dinner has a direct influence (indicated by the directed arrow) with
respect to the number of hours slept that evening. We assume the relationship isn't inverse: there's no arrow
from HS to D, which makes sense temporally since dinner occurs before sleep.
Also W will impact HS directly the same way. Without drawing any line from
D to W
we are stating that the amount of carbohydrates consumed at dinner does not influence in any way the fact that
the patient will take the walk or not.
2. Testable implications
But is it true that the amount of carbohydrates consumed at dinner does not influence in any way the choice of taking a walk? One might hypothesize that, for example, a high amount of carbohydrates can lead to a physiological or psychological response that might influence the probability of taking a walk.
In some cases, we can use tools that, given our DAGs, can use the observed data to suggest whether our
assumptions are correct or not.
One such methodology is using testable
implications. In our simple example, since there are no arrows
connecting W to D, and there are no common causes or indirect paths between them, we
are stating that the two
variables are statistically independent. Using observed data, we can actually test this assumption! There are
many ways to do so, and
a success or a failure of the test does not offer complete certainty, but it is a great principled way to reduce
uncertainty.
There are clever tools that automate this process. If you have a diagram with tens of variables and hundreds of connections, we can have a list of all the possible tests that we could make.
3. Statistical modelling
With regard to the modelling phase, any method that produces some estimation of a model's parameter can be used in combination with a lot of causal frameworks. Bayesian methods, for example, are particularly well-suited for this task because they can work with progressively available data and clearly manage confidence levels, especially in relation to sample size and the ability to specify prior knowledge through prior distributions.
4. Managing interventions
If you intervene on the variables at some point, you have to account for it in the modelling phase. There are multiple ways to do so, from do-calculus, multilevel model, to using intervention indicators in your model. What I personally like is to keep one approach throughout the modelling phase so that I don't have to manage different methodologies, but I've seen professionals that were experienced enough to juggle different approaches accounting for the different assumptions and 'philosophies' of each. I'm not such a man.
Challenges
The Unknown Variables Problem: We must recognize that there could be one or more unmeasured variables that could not only influence all estimates of causal relationship strength but also their direction. A relationship might have the opposite effect to what we estimate: If I expect that increasing one variable will decrease another and rely on this result to implement a change in the patient's life, the variation might turn out to have the opposite effect.
Circular Relationships: To make the problem tractable, we generally avoid introducing circular or bidirectional relationships because we wouldn't have the mathematical tools to understand what would happen if we changed a specific variable. We're therefore assuming that none of these relationships, which might exist, significantly influence our analysis. If they were significant, we'd have to abandon the analysis a priori, acknowledging our inability to provide an answer regardless of the mathematical machinery used.
Temporal Complications: Related to the previous point, and for practical reasons, we include variables recorded at different times in our model. But this raises a number of problems. The most common is that it is difficult to know what past variables influence future variables and for how long. Dealing with time can also lead to implementation errors in the actual modelling phase.
Psychological Factors: As we've seen in our example, the psychological aspects cannot be ignored. The possible influence of
D on W, is more psychological than physiological. The discipline of walking after dinner is a habit, mainly regulated by mental factors. Physiological factors can intervene when they promote a momentary wellbeing, that makes it easier to perform certain actions, or vice versa. There are a lot of these cases, but they vary from patient to patient in significant ways. On one hand, we can't ignore them, but from a technical standpoint, we're mixing causes that act on the physiological profile with co-causes that act on the psychological profile. This should make our interpretation of results even more cautious. Not to mention that it is not intuitive if we should try to model the psychological influences through proxies or not.
Measurement Error: This type of model implicitly assumes that variables are measured without errors, which obviously isn't the case, at least in this domain. Every measurement, from blood glucose levels to sleep duration to carbohydrate intake, contains some degree of uncertainty. It is a somewhat open question how to deal with this problem.
Model Complexity: Models are enormously influenced by subjects' lifestyle changes, so we essentially always find ourselves working with limited data because we cannot, at least not always, mix observations that arise from two very different lifestyles. It's therefore necessary to use methodologies that clearly define the margin of error we're working with when we have few observations. In order to deal with this, we can use the same statistical machinery that we use to deal with interventions.
Lifestyle Changes: Models are enormously influenced by subjects' lifestyle changes, so we essentially always find ourselves working with limited data because we cannot mix observations that arise from two very different lifestyles. It's therefore necessary to use methodologies that clearly define the margin of error we're working with when we have few observations. In order to deal with this, we can use the same statistical machinery that we use to deal with interventions.
Future Data Leakage: As we alluded before, dealing with time is always tricky. A very common error is attributing "future" data to a variable. This means that when calculating a variable at a specific time point, we accidentally use data that will be produced at a future time point. This is an unfortunate problem that gets spotted all the time, for example during the review process that precedes a paper publication.
Working Around the Limitations
Deep Subject Knowledge: First and foremost, thorough knowledge of the person's lifestyle is necessary. This means having access to a caregiver who potentially lives with the subject, or dealing with a patient who is particularly self-aware and meticulous about tracking their habits.
Practical methods: Some methods help more with dealing with all the challenges mentioned above. Take a look at the code if you are interested in the more technical side, but that's just scratching the surface. From experience, the more a method is 'transparent' and easy to implement, the more the analyst can focus on the logical implication of what these tools are producing. If a method is really complex, sometimes it can be hard to derive second order implications from the results, or spotting errors or patterns.
Targeted Data Collection: Data collection must be focused. The time horizon must be well-defined as you can't ask a patient or caregiver to record a large amount of data for an extended period. If you can't identify a solution within a reasonable timeframe, the data analysis approach isn't suitable for the problem.
Where This Approach Excels
Based on my very limited sample size compared to hundreds of millions of patients worldwide, this approach works very well for "fixing" conditions not directly related to diabetes management itself. For example, sleep duration is certainly influenced by glucose levels and other factors, but it doesn't participate in the physiological mechanisms that regulate blood glucose like insulin does.
Other scenarios where I've seen considerable success include: improving symptoms management during endurance physical activities (running, endurance sports); reducing mental fatigue and improving concentration and mood in stressful situations; reducing episodes of sudden energy drops or drowsiness due to eating patterns and medication management.
While we may never achieve perfect causal inference in complex health scenarios, this kind of framework provides a principled approach to extracting actionable insights while remaining appropriately humble about the limitations of our models.
Thank you
As always, thank you for reading this.
If you want to send me something, XY at gmail.com where X = tommaso and Y = bassignana, no dots between X and Y. Whoever you are, don't hesitate! I respond to everybody :)